Grandad Forgot My Name

You may associate us with archaeology, environment and ecology but we dabble in all sorts of fascinating subjects. And here’s a totally new one for you today…

Our interactive stories into dementia care have now been released!!

Dementia is a global epidemic, affecting millions worldwide. You’ll be hard-pressed to find someone who doesn’t know someone affected by dementia. This has caused a major problem that there just isn’t enough resources to help provide the pastoral support to those with dementia and their families. Children find it especially difficult to understand.

So where do we come in? Well as you know, we love public engagement and digital tech. And so, we’ve been quietly working away at making interactive digital storytelling media focused on helping children (and adults) understand dementia in their loved ones. But of course, why listen to us talking about it when you can try it out for yourselves! Just follow this link and click “Run Book”

This is completely new for us and for healthcare. Does it work? Is it worthwhile? The honest answer is, we dont know! But we’re ecstatic to find out.

Enjoy!

Digging up Memories – Making a Digital Exhibit

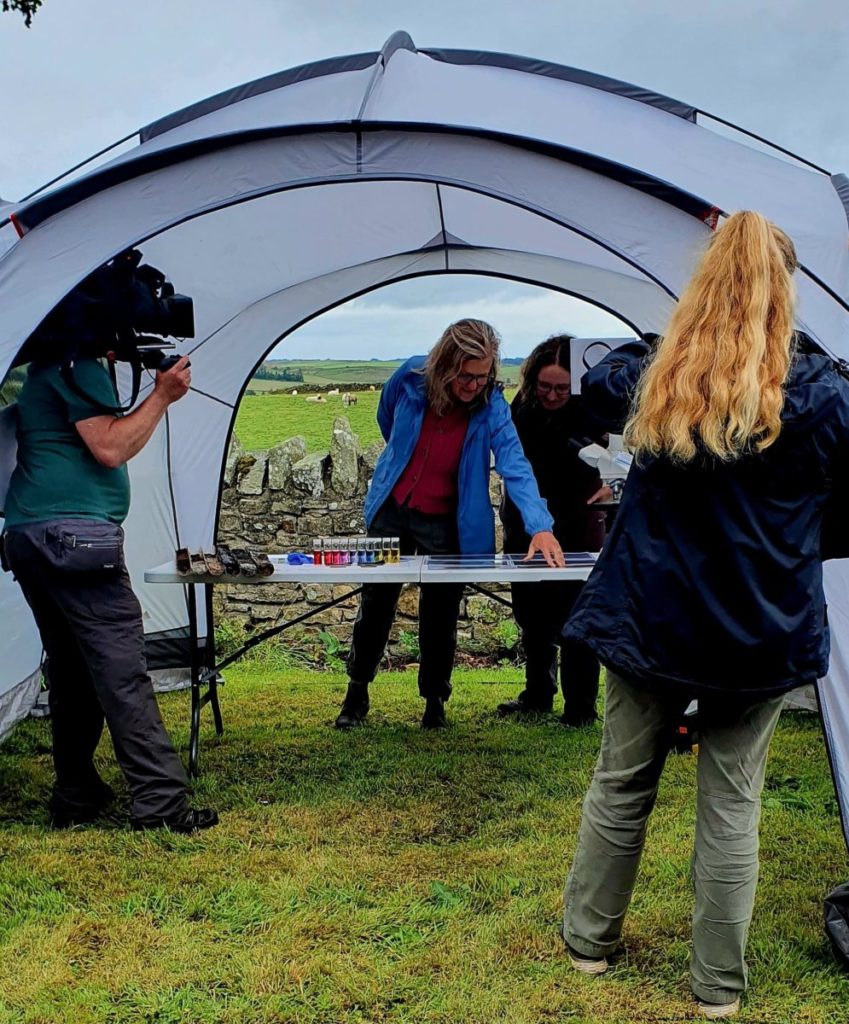
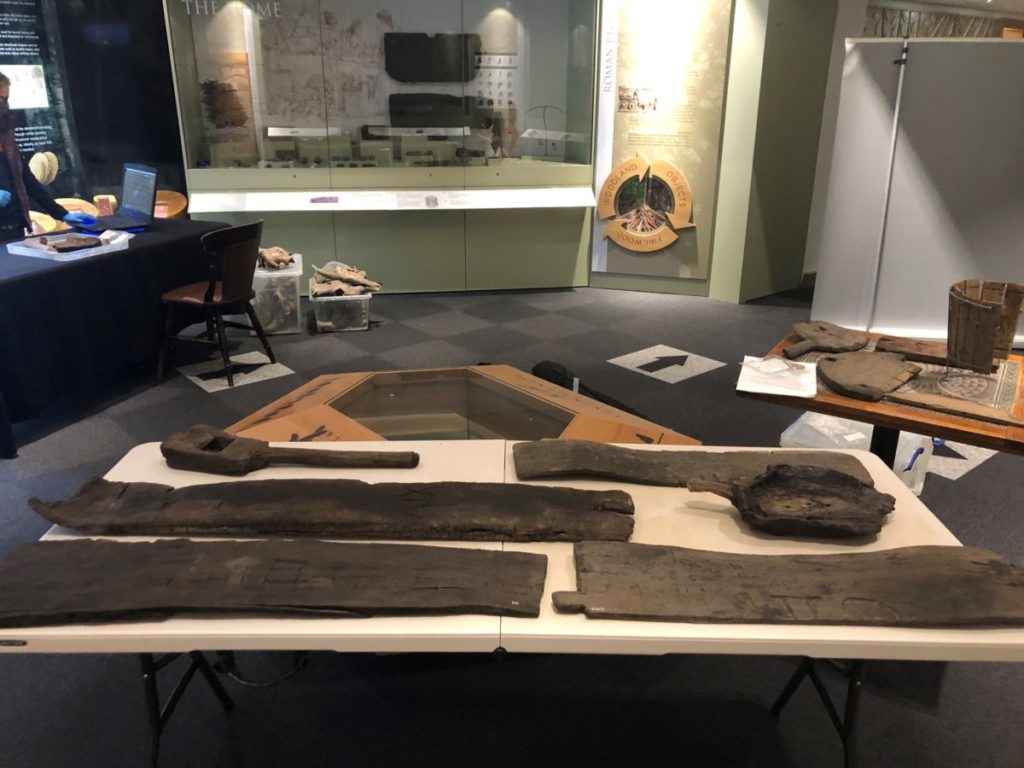
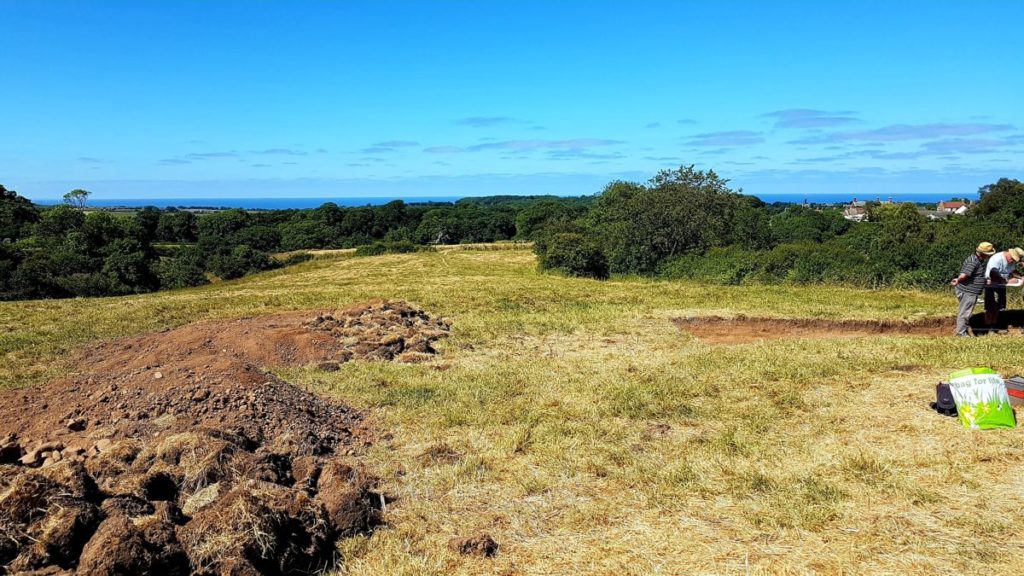
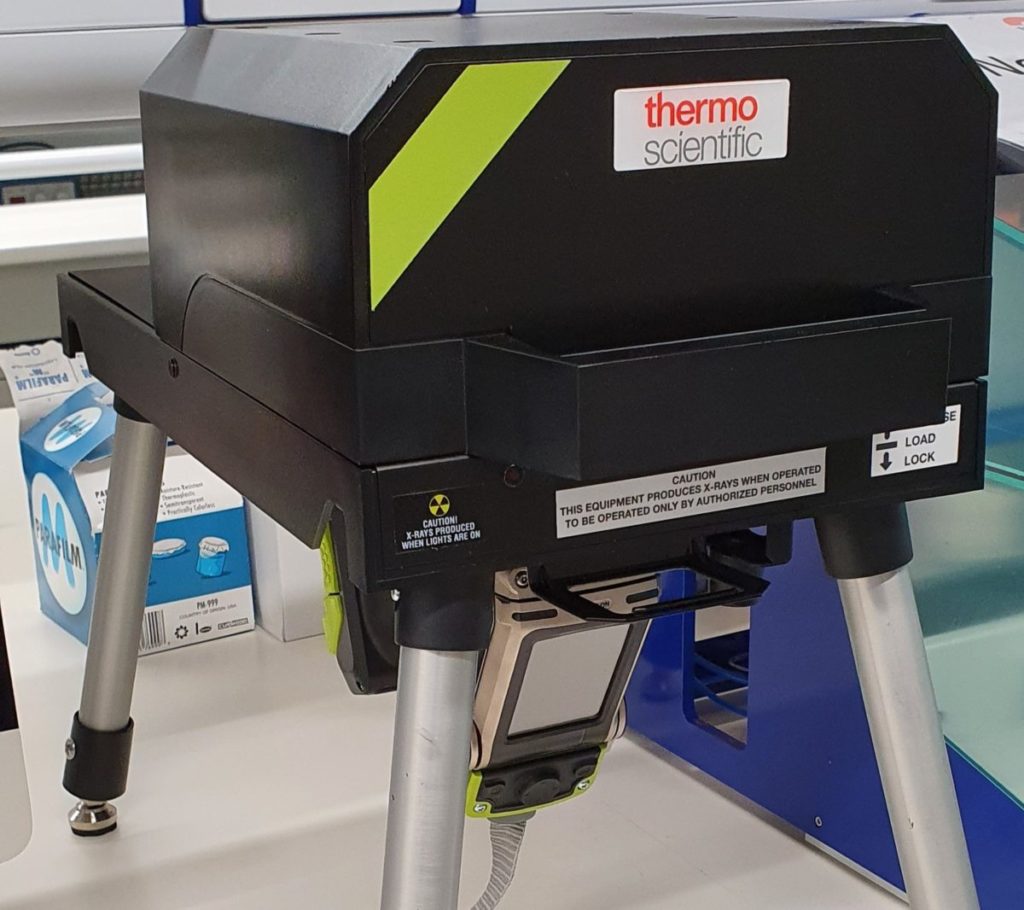
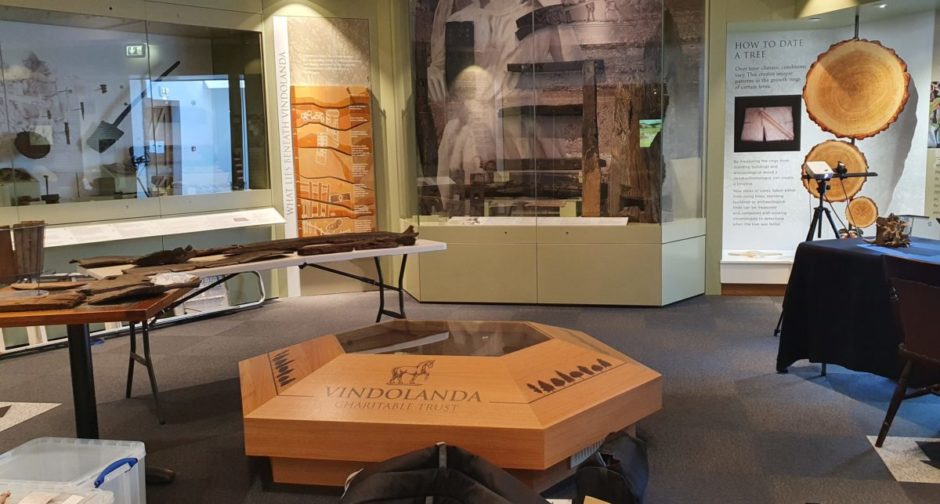
You may remember a previous blog post when we set out 3D scanning a whole range of different wooden artefacts for the Digging up Memories – Making Connections online exhibit with Vindolanda Museum. Well here we are, looking back at all the successes and improvements after the exhibit was released to the world! We’ve recently written about online exhibits in the book Hadrian’s Wall: Exploring Its Past to Protect Its Future, but here we’re going to review through our recently published paper on the Digging up Memories exhibit.

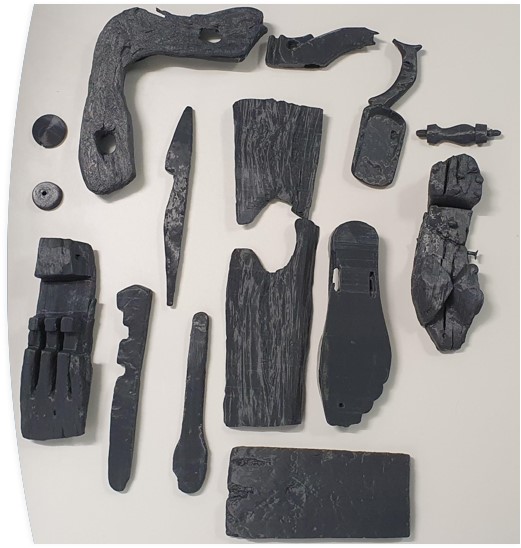
This exhibit focused on the precious objects that comprise the Wooden Underworld collection at Vindolanda. Objects were selected by museum workers, volunteers and contributors to ensure co-curation in the exhibit, branching the breadth of roles at Vindolanda Museum. The exhibit was held on the Vindolanda website to help ongoing public engagement during limited visitation times and beyond, still remaining accessible today.

The Digging up Memories landing page – a whole range of different themes and objects to explore!

Our early priority was multimedia excitement. Yes that sounds like a bit of a buzzy phrase but essentially, we want several types of media to engage the different preferences and interests of our audience. This meant not just 3D models but also photos, sound bites, video interviews, voice recordings of contributors, lectures, creative writing, published reports, all sorts! Clearly this had some attentive impact, achieving an average 1 minute 35 seconds spent viewing per page (compared to the “typical” museum exhibit times of half a minute).

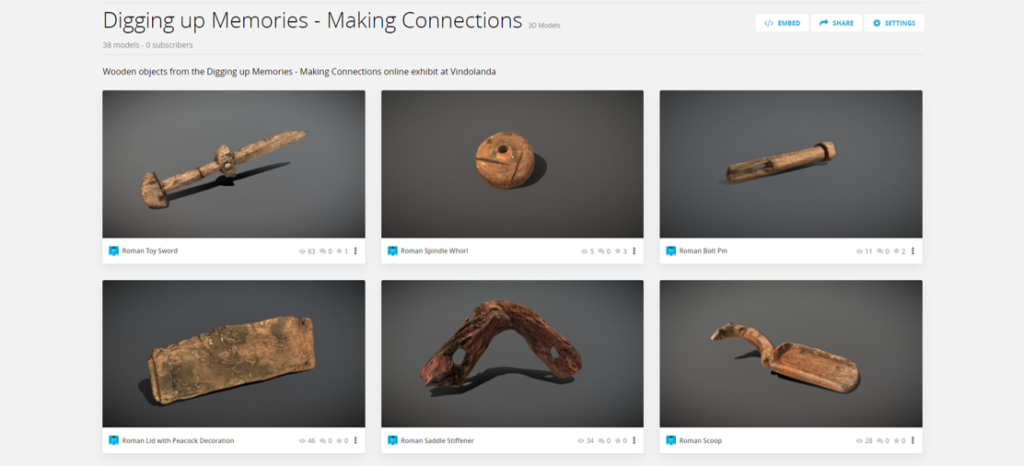
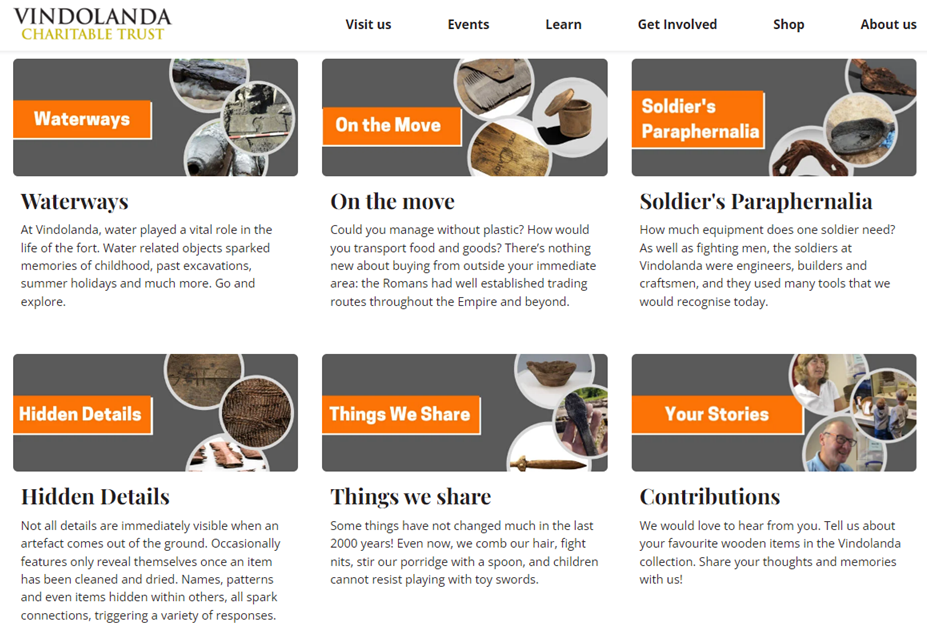
Now you may be wondering, which objects were the most popular? First, why not take a look at the exhibit yourself and pick out which one is your favourite!

Had a look? Great! The Things We Share page was the most visited, with the Toy Sword achieving the most views overall. Personally, we love the toy sword – Rhys even gave an interview about it in the exhibit!

A key question was “so… was it worthwhile?”. Yes! We had so much valuable feedback but the most valuable measure for us was that 88% of respondents felt encouraged to look further into Vindolanda and Roman history. Now that is a clear success for museums hosting online exhibits! If you’re interested in setting up your own online exhibit, check out the publication which goes into more detail, and offers suggestions and recommendations for future projects.

Isn’t technology great?

Cold Ice in a Warm Windy Bath – Report from a Field Season in the Arctic

The GLRETA project captures changes in one of the most dynamic parts of an Arctic mountain environment, by measuring lake temperatures in front of a glacier (proglacial) and the regularity of iceberg calving events (monitored by time lapse cameras) driven by thermal undercutting of the glacier terminus. This has proved to be a challenging environment to undertake field work in, as we have to regularly adapt plans to collect data when the weather windows arrive and hope that icebergs don’t wipe out our temperature sensors in the meantime.

Boaty conducting sonar scan and temperature survey along Kaskasapakte proglacial lake. Aug 2022. Photo; A. Dye

The Arctic summer weather can be very variable in Scandinavia and this year has been no exception. The boulder ‘reinforcements’ of our weather station proved to be successful as it survived the 135 km/h wind gusts largely intact. Sadly our base camp tent didn’t fare so well over the summer and also incurred some substantial damage to the door from some passing fauna. On discovering this at the start of trip 2 we realised that scientific objectives had to be postponed as fixing the tent up before the bad weather arrived was ‘rather critical’. Thankfully after 3 days of floods and high winds we were able to forget about base camp maintenance and get back on with the science.

Flooding wiped out our food storage point and nearly flooded our tent on 2 occasions. 60mm of rain in 12 hours is rather a lot! Photo; A. Dye

Mercifully we were presented with one of the best weather days I can remember in the Arctic and promptly set about compressing 3 days into one rather long one. First on the agenda was a dSLR camera survey to create a digital surface model of the glacier, to calculate how much the ice has lowered from melting during the summer and how much ice has been calved off in icebergs. The glacier front had changed a lot between our visits over the summer, as about 5m wide strip of ice had been calved off across the terminus and the crevasses behind it had widened substantially. Thankfully our time lapse cameras caught these iceberg calving events, along with the changing lake conditions during the summer. Our inflatable kayak mission was successful in retrieving the key lake temperature data sets, which had risen to a maximum of 4oC in late July before steadily cooling from late August. This will provide an important record for understanding how lake conditions and temperature correspond to iceberg calving events, combined with sonar scans of the terminus to understand how the underwater ice front geometry promotes calving.

GoPro image along Norra Kaskasapakte calving front. Note the large thermally eroded notch at the weaterline. Photo; A Dye.

The recent warm events in Arctic Scandinavia will have enhanced melting of glaciers in the area during the heatwave events, which are predicted to become more frequent with climate change. So we have also been creating digital surface models of other glaciers in the area, to assess how much surface lowering has occurred on these land terminating glaciers. We can then compare the surface lowering of land terminating glaciers to the lake terminating glacier, to assess how they are all responding to recent warm events. We also want to greater understand how contact with a proglacial lake can enhance glacier retreat too and how they are likely to respond to future changes in climate.

Norra Kaskasapakte glaciar, August 2022. Photo; A.Dye

TUBA on the Tube! BBC Countryfile Meets Archaeology

If you’re interested in people, places and stories making news in the British countryside, and appreciate a bit of good BBC programming, then we’re sure you’d love to catch the next episode of Countryfile, tonight at 8pm, 7th August, BBC Two. We’re particularly excited for this episode because it features a strong segment of excavations and climate research at Vindolanda and Fort Magna, including some of the chemical and microbial analysis we’ve been undertaking!

Talking through some of the many scientific experiments on the go!

Why is our science research so important to old, buried fields? Well, Fort Magna is next to a substantial bog with conditions similar to the excellent preservation seen at Vindolanda. However, the gradual impact of climate change has resulted in a significant reduction of the preserving bog due to the soils drying out. Consequently, the bogs are compacting on themselves, crushing the archaeology within. You can see this clearly in drone footage, where the top of a Roman well is now exposed above the ground. This is now occurring at an alarming pace due to the rapid increase in global warming and climate change, endangering the history beneath our feet.

And so, TUBA’s role here is to conduct ongoing surveys into the soil across the site, looking at the past, current and potential future of the burial conditions; are we maintaining an anaerobic and slightly acidic environment? Are the areas of Roman occupations still kept within waterlogged conditions? Is the microbial profile remaining unchanged and non-degenerative? How far out does the site go, and how close to the edge of the bog does it reach? Using a combination of chemical and microbial analyses with the multidisciplinary team at  TUBA will shed some light on these questions and help answer some key questions in the maintenance and management of British heritage.

This slideshow requires JavaScript.

We hope you get a chance to catch the episode – we had so much fun and were proud to take part in this filming for Countryfile alongside Vindolanda!

TUBA

Cold Ice in a Warm Bath

July 2022 GLRETA Arctic Fieldwork Report

We had planned to arrive in the Arctic in the narrow window between Kas’ proglacial lake becoming ice free and the first warm event of the summer, so that we could measure the lake temperatures as they changed as the summer progressed. Unfortunately summer was already well underway as the first real warm event of the season occurred before we arrived, which also seemed to bring numerous mosquitoes with it. In previous trips I had not encountered mosquitoes at our base camp 1000m up in the Arctic/Alpine environment of the Kebnekaise mountains in Sweden. They were not the only signs of warming in the landscape, as our first night trying to sleep in 24 hour daylight (tricky in a tent) was further disturbed by a couple of rather large rockfalls from the surrounding mountains.

Transferring a lot of 20kg bags of equipment between trains… photo. A. Dye
Mike B. and Miles D. setting up the automated weather station underneath the careful watch of mosquitoes at basecamp. Photo A. Dye.

After a somewhat ‘testing’ journey with a substantial amount of baggage, we still had enough energy to scramble over the moraines and see how the glacier front had changed since I saw it 3 years ago. The usual moments of ‘bittersweet’ emotions as the scientist keen to understand a dynamic environment, whilst the environmentalist in me didn’t want to see how much the glacier had retreated. The moraines and environment around the glacier did seem greener, with areas of bare sand now mostly moss covered as well as grass and small Willows becoming more established on the moraines, which also made the going much easier underfoot. The stabilisation of the moraine from vegetation was certainly appreciated and enabled good view points to be accessed more easily.


Mike undertaking a handheld dSLR survey of Kas’ glaciar to create a digital surface model from Structure from Motion. Photo A. Dye

The glacier front had changed quite substantially since I last saw it in September 2019, the large cave in the centre had gone and the majority of the front was less steep, with rounded features that suggested melt processes above water had dominated. The absence of any angular ‘fresh’ cavities on the front confirmed that we had arrived before any icebergs had calved this summer. The large thermally eroded notch running across the full length, suggested that it would not be too long before iceberg calving began… Prominent crevasses behind the central section of the front suggested that a substantial block was waiting to calve from the front, so boaty II was deployed a ‘relatively’ safe distance (20m) away and recorded near surface temperatures of 3 C and a maximum depth of 20m at the ice front, much warmer than I had expected for early July. It was clear that the proglacial lake temperatures and influence on the glacier morphology and retreat rates needed further investigation in what appears to be another eventful third field season.

Boaty II conducting surveys of Kas’ glaciar front July 2022, Arctic Sweden. Photo A. Dye
Boaty II conducting surveys at Kas’ glaciar, Sweden. Photo A. Dye

Working on proglacial lakes can be ‘rather challenging’ most of the time, but occasionally you are gifted with weather windows when it’s ‘all systems go’ in order to get as much data as possible. There was no time for resting after the journey and repeated load hauling (shifting 100kg of baggage through 5 coaches of a busy train isn’t fun) as we installed time lapse cameras, weather station and calibrated thermistors before readying the inflatable kayak for launch. The cold (6 C) cloudy morning morphed into a relatively sunny afternoon and changing into a wetsuit by the side of a cold sediment filled glacial lake in the Arctic was starting to seem less of a crazy idea. Once we’d got our main temperature string installed (with a robust marine buoy…) it even started to seem like a good idea, which may come off if it survives a summer season of icebergs bombarding it and hopefully captures the lake response to whatever summer 2022 throws at it… We paddled on towards the glacier and dropped another thermistor string as close to the front as we dared risk with the impending iceberg blocks waiting to calve about 100m away. It was a relief to be heading away from the glacier and it almost felt pleasant as we drifted away to safety and managed to get another thermistor string stuck in the rocks at the far end of the lake.

Installing thermistor strings on a buoy in the middle of a lake in the Arctic (July 2022). Photo A.Dye

We returned to the glacier front the following day and whilst Miles mapped the lake bathymetry in front of the glacier, Mike dropped some fluorescein dye into streams on top of the glacier. It seemed inevitable that Dr Dye had to use dye tracing at some point, but also proved to be very useful in seeing how meltwater enters the lake and drives currents along the glacier front, which further enhance the thermal undercutting and iceberg calving rates. We also discovered meltwater upwelling in the glacier up to ~5m above the lake level. Why was meltwater being pushed up this high? How would this affect the glacier front? What would happen when rainfall events pumped water through the system? As I typed this it was 3 C and raining/sleating heavily outside. I wouldn’t like to predict what the summer season will bring for Kas’ glaciar this year. It seems pretty crazy that we are now preparing to leave the Arctic and return to temperatures over 30 C in the UK… Hopefully the heatwaves won’t happen in the Arctic this year… We’ll find out how Kas’ glaciar has changed later in the summer and compare the surface changes to other glaciers in the neighbouring area. Watch this space!

Arctic Field Season Preview – Cold Ice in a Warm Bath

The Cold Ice in a Warm Bath (CIWB) research team (Dr. Adrian Dye, Dr. Joe Mallalieu, Dr. Fran Falcini, Mike Beckwith and Miles Dimbleby) are busy preparing for their 2022 field season in the Arctic. They work in an area of the Arctic that has recently experienced a number of unusual summer heatwaves (with monthly means >5oC above the long term average; Dye et al., 2021). The 2022 field season research will show how much proglacial lakes (at the terminus of glaciers) enhance retreat rates in their ‘Glacier and Lake Response to Extreme Temperature Anomalies’ (GLRETA) project, which has been funded by INTERACT and the Royal Geographical Society.

A series of Arctic glaciers will be surveyed (by UAV) to create digital surface models from photogrammetry (using SfM) and assess the glacier retreat that has occurred in response to the heatwaves since 2015. Crucially this will be combined with sonar surveys (from remote controlled boat) and carefully placed (to avoid icebergs!) temperature sensors to constrain subaqueous melt of Kas’ glacier in relation to proglacial lake warming during the summer. This will be the third field season that the team has spent at Kas’ glacier. If it is anywhere near as eventful as the previous two, they will capture the frequent iceberg calving events (on timelapse) and hopefully one of the longest temperature records from an Arctic proglacial lake (if icebergs don’t disrupt it too much!).

The calving front of Kaskapakte (Kas’) glaciar in Arctic Sweden (July 2019).
Boaty II conducting sonar surveys of the underwater terminus of Kas’ glaciar whilst filming ice structures by GoPro.

Happy Birthday Hadrian!

This week marks the 1900th Birthday of Hadrian! Born on 24th january 76 AD in Italica, Spain, Hadrian was a Roman conquerer that lead the Romans toward entrenchment and consolidating the empire rather than ongoing expansion. And so, we’ve got a doozy of updates for you in our first post of 2022 – which we reckon will be called 202TUBA!

Revealing Magna

This week, Vindolanda was featured on BBC Breakfast showing the incredible impact of Climate Change at Fort Magna. The rapid heating and drying of climates over the past few decades have led to a drop in the ground and water levels, resulting in parts of Roman masonry becoming exposed. Vindolanda Trust produced an absolutely fantastic video to discuss this:

We’re absolutely thrilled to be part of the scientific investigation into why these changes are being observed, and the rapid destructive impact being made to the delicate artefacts that have been preserved for thousands of years. We started this work last summer, drilling bore holes in what turned out to be the hottest week of the year – and the hottest summer on record! We have never been so grateful to see a single lone tree in the field offering shade for refuge…

Digging up Memories

We’ve also been part of the Digging up Memories online exhibit (we chatted a little about this here), which saw volunteers at Vindolanda Museum select and discuss their favourite wooden artefacts. Through the online exhibit, you can find interviews, videos, behind-the-scenes information and many of our 3D models showcasing a wonderful narrative of life at Vindolanda.

Intense 3D scanning days led toward an awesome online exhibit!

We urge you to check it out and dive through the archives! You can still view them at: www.vindolanda.com/Listing/Category/digging-up-memories

Individual Milestones

As this is our first post of 2022, we thought it would be nice to have a quick look at some of the milestones achieved by the team.

We published the first work we started with Vindolanda in Scientific Reports, writing all about the chemical and microbial factors toward the vivianite formation in one of the ditches at Vindolanda. We’re thrilled to see this come out to such great reception!

Helga submitted her 31 MB thesis (plus supplementary files!) in time for a well-deserved Christmas break with baby Breki.

Rhys was awarded his doctorate in Developing pXRF soil analysis of preservation at Vindolanda, and is now Lecturer in Forensic Science. Congrats Dr Williams!

Gillian was appointed Associate Professor in Research at Teesside University where she’s already powering through the development of analytical techniques towards forensic and archaeological applications.

Becki Scott joined Teesside University and TUBA in September – we’re looking forward to driving forward provenance research with her fantatsic expertise. Look out for some of our blog posts together coming soon!

New year new me, except clearly TUBA has always been dedicated to high quality research and public engagement – we’re allowed to gloat in the conclusion, right? Until next time!

TUBA

Online Exhibit: Digging up 3D Memories

This summer, TUBA were hard at work with 3D scanning for the Digging up Memories – Making Connections online exhibit that has now officially gone live! You might even have seen snippets yourself or read about it in the recent Teesside University press release. And so, we thought it’d be nice to give a little behind-the-scenes of this amazing opportunity.

How does 3D scanning actually work? Well, there are lots of different types of 3D scanners, all with their own applications and uses. For this exhibit, we used a structured light scanner (SLS), which works by projecting a tightly calibrated set of patterns onto an object. The pattern changes shape as it falls onto an object, resulting in 3D measurements. This process takes a full, closed scan of the camera view, which we then apply a texture to by applying red, blue and green light filters:

This slideshow requires JavaScript.

How can we use this in our work with Vindolanda? As you may have noticed in some of our previous blog posts, we’re big fans of 3D here, including animal and human heads on pikes, and the Locomotion. We’ve even published on 3D scanning of ox crania used in target practice, and have some further outputs on their way. The key outcome from 3D scanning for the museum environment is access. How often have you visited a museum and though “hey, that’s a pretty cool object, I wanna look closer”? 3D scanning provides a digital model of the object that you can freely zoom in and out or rotate around, which is.. well, pretty neat! However, we can then run some bespoke processes to make these 3D printable. That’s right – you can properly get hands-on with highly accurate replicas of delicate and fragile museum objects!

So where does this lead us? Well, over the years, we’ve been partaking in several exhibits on the 3D scanning, chemical and microbial work we’ve been undertaking at Vindolanda. Following the success of these, we were invited to Vindolanda over the summer to explore the suitability of 3D scanning a wide range of wooden objects. To say we were excited and proud of this opportunity is an understatement!

There is such a fabulous range of wooden artefacts available for your viewing from the comfort of your sofa, so please do look at these either on Sketchfab or better yet, on the Digging up Memories exhibit on the Vindolanda website! Here, you can find more information, videos and commentary on each object plus the 3D models. Some of these are incredibly rare, such as the only conserved wooden toilet seat in Britain, the cherry wood saddle stiffener, or the wooden trowel with mortar still stuck to it!

Just a few of the wooden objects available. Click the image to view them all!

We do have a couple personal favourite objects, of course. The wooden toy sword is an excellent artefact because it really demonstrates that the military took their families with them to Vindolanda, rather than the typical focus on conflict and fighting. The pepper pot is also great because of how well the 3D scanning came out – we had anticipated this to be poor because it’s a very cylindrical object that normally doesn’t facilitate 3D scanning but there was just enough of an irregular morphology to stitch together and texture beautifully. Atto’s Workbench is also a fantastic object but the sheer size and lack of thickness meant it took more scans and time than any other object we’ve scanned in order to fully capture and register together. This was well worthwhile because you can actually feel the hammer impressions on the 3D printed version!

Just some of the 3D printed objects available for handling at the museum!

And that brings us nicely to our final point – hopefully over the coming days, weeks and months, you’ll have the opportunity to visit Vindolanda and get hands-on with some highly accurate 3D printed versions of a wide selection of these wooden artefacts! We cannot recommend this enough; this evokes such a different set of emotions and leaves an experience that lingers for a long time. Who knew that something as banal as opening and closing a pepper pot lid could be so captivating!

How did all of this come about? Purely thanks to so many people involved, coming together for this collaborative effort, with Vindolanda Trust and Dr Anneke Hackenbroich driving this project forward. Our utmost thanks to them for inviting us to be part of this special exhibit, we’re all thrilled here to see it come together as I’m sure all are at home too!

Lastly, keep an eye out for updates to the Digging up Memories – Making Connections exhibit, with more objects being added at the start of November and December.

TUBA

Slogging for Skelton

Just this week, our new paper on “Mapping an archaeological site: Interpreting portable X-ray fluorescence (pXRF) soil analysis at Boroughgate, Skelton, UK” was published! And so, we thought it would be nice to share some of the work that went toward this with you all.

Boroughgate was a 12th Century medieval borough in Skelton, North Yorkshire UK, near the All Saint’s Old Church and Skelton Castle. It was placed in the perfect location to support trade and income for the castle via but unfortunately it was unsuccessful and abandoned around 1400 CE. The remnants of earthworks at the site and medieval documentation recording some of the tradespersons at Boroughgate gave some clues as to the history of the site. Tees Archaeology went through a series of surveys before excavating the site, inviting us out to complete some pXRF analysis and explore whether pXRF elemental analysis can enhance and support their interpretations of the site. This was also an excellent opportunity for us to show the value of our method development for pXRF soil analysis in archaeology! Admittedly, this also may have been a bit of an excuse to get out on such a glorious Summers day…

Better get the sun lotion on because it’s a scorcher at Boroughgate!

pXRF is often seen as a rapid point-and-shoot method  but for good quality data, we really need an appropriate methodology. The soil matrix can vary greatly over just short distances, and we need to make sure that all our soil is examined in the same way, otherwise our comparisons are inconsistent and not well validated. We extract soil samples, dry them in the lab (preferably oven dried), grind down and sieve the samples so they’re nice and homogenous, and prepare them into pXRF sample cups. This does of course mean that we end up with a fair bit of soil samples in the lab from just one small area of soil..!

Nice selection of sorts sorted for scanning back at the lab

Research into social organisation and the activities or use of space from archaeological excavations uncover hidden knowledge on past societal practices and the structuring of historic communities. This work explored whether we could map out the elemental distribution of soil to identify different activity areas. This is discussed in much more detail in the journal article but just briefly, the distribution of aluminium, phosphorus, potassium calcium and iron distinguished between the internal dwelling and external area of a longhouse. Aluminium, potassium and calcium also distinguished a likely clean or food preparation area against a refuse area. These areas also aligned closely with the locations of artefacts such as pottery fragments, daub, and domestic or charred waste, as well as structural remains such as building foundation pads, postholes and wall foundations.

Summary of the pXRF interpretation. More pictures and diagrams in the paper!

This was a well worthwhile investigation into mapping pXRF of soil which we’re very excited to continue further. Don’t hesitate to contact us if you’re interested in surveying your site with pXRF, we’d love to see how much more we can learn about past communities with pXRF! Now before you go, don’t forget to say hi to the ridiculously sweet kitten which I’ve dubbed Sandy the Archaeology Cat because of its love for sitting in soil buckets and climbing over your shoulders judging your use of the Harris Matrix:

Sandy is the sweetest!

And finally, thanks to David Errickson at Cranfield University, and Tees Archaeology for inviting us out to your site!

TUBA

Sustainable Drainage Research at Climate Exp0

Dr Ed Rollason, along with colleagues at Durham University and University College Dublin are collaborating on a project exploring how we conceptualise Sustainable Drainage Systems (SuDS) as mechanisms for enhancing high density urban environments. They are currently exhibiting a poster on the work at Climate Exp0, a free conference being run as a prequel to the COP26 climate summit to be held later in the year.

Sustainable drainage systems are key components of urban drainage infrastructure for new build houses. However, retrofit takeup of SuDS is low and generally unimaginative, and projects often do not meet their aspirations for delivering multiple benefits. We argue that identifying the effectiveness and potential for retrofitting SuDS requires understanding the nexus between the nature of the problem being addressed, the place in which the intervention is being implemented, and the level of investment which is being made available. This paper will propose a new conceptual model integrating these factors which will allow SuDS designers and promoters to better understand where and how to implement SuDS to achieve the greatest chances of success and the greatest co-benefits.