Cold Ice in a Warm Windy Bath – Report from a Field Season in the Arctic

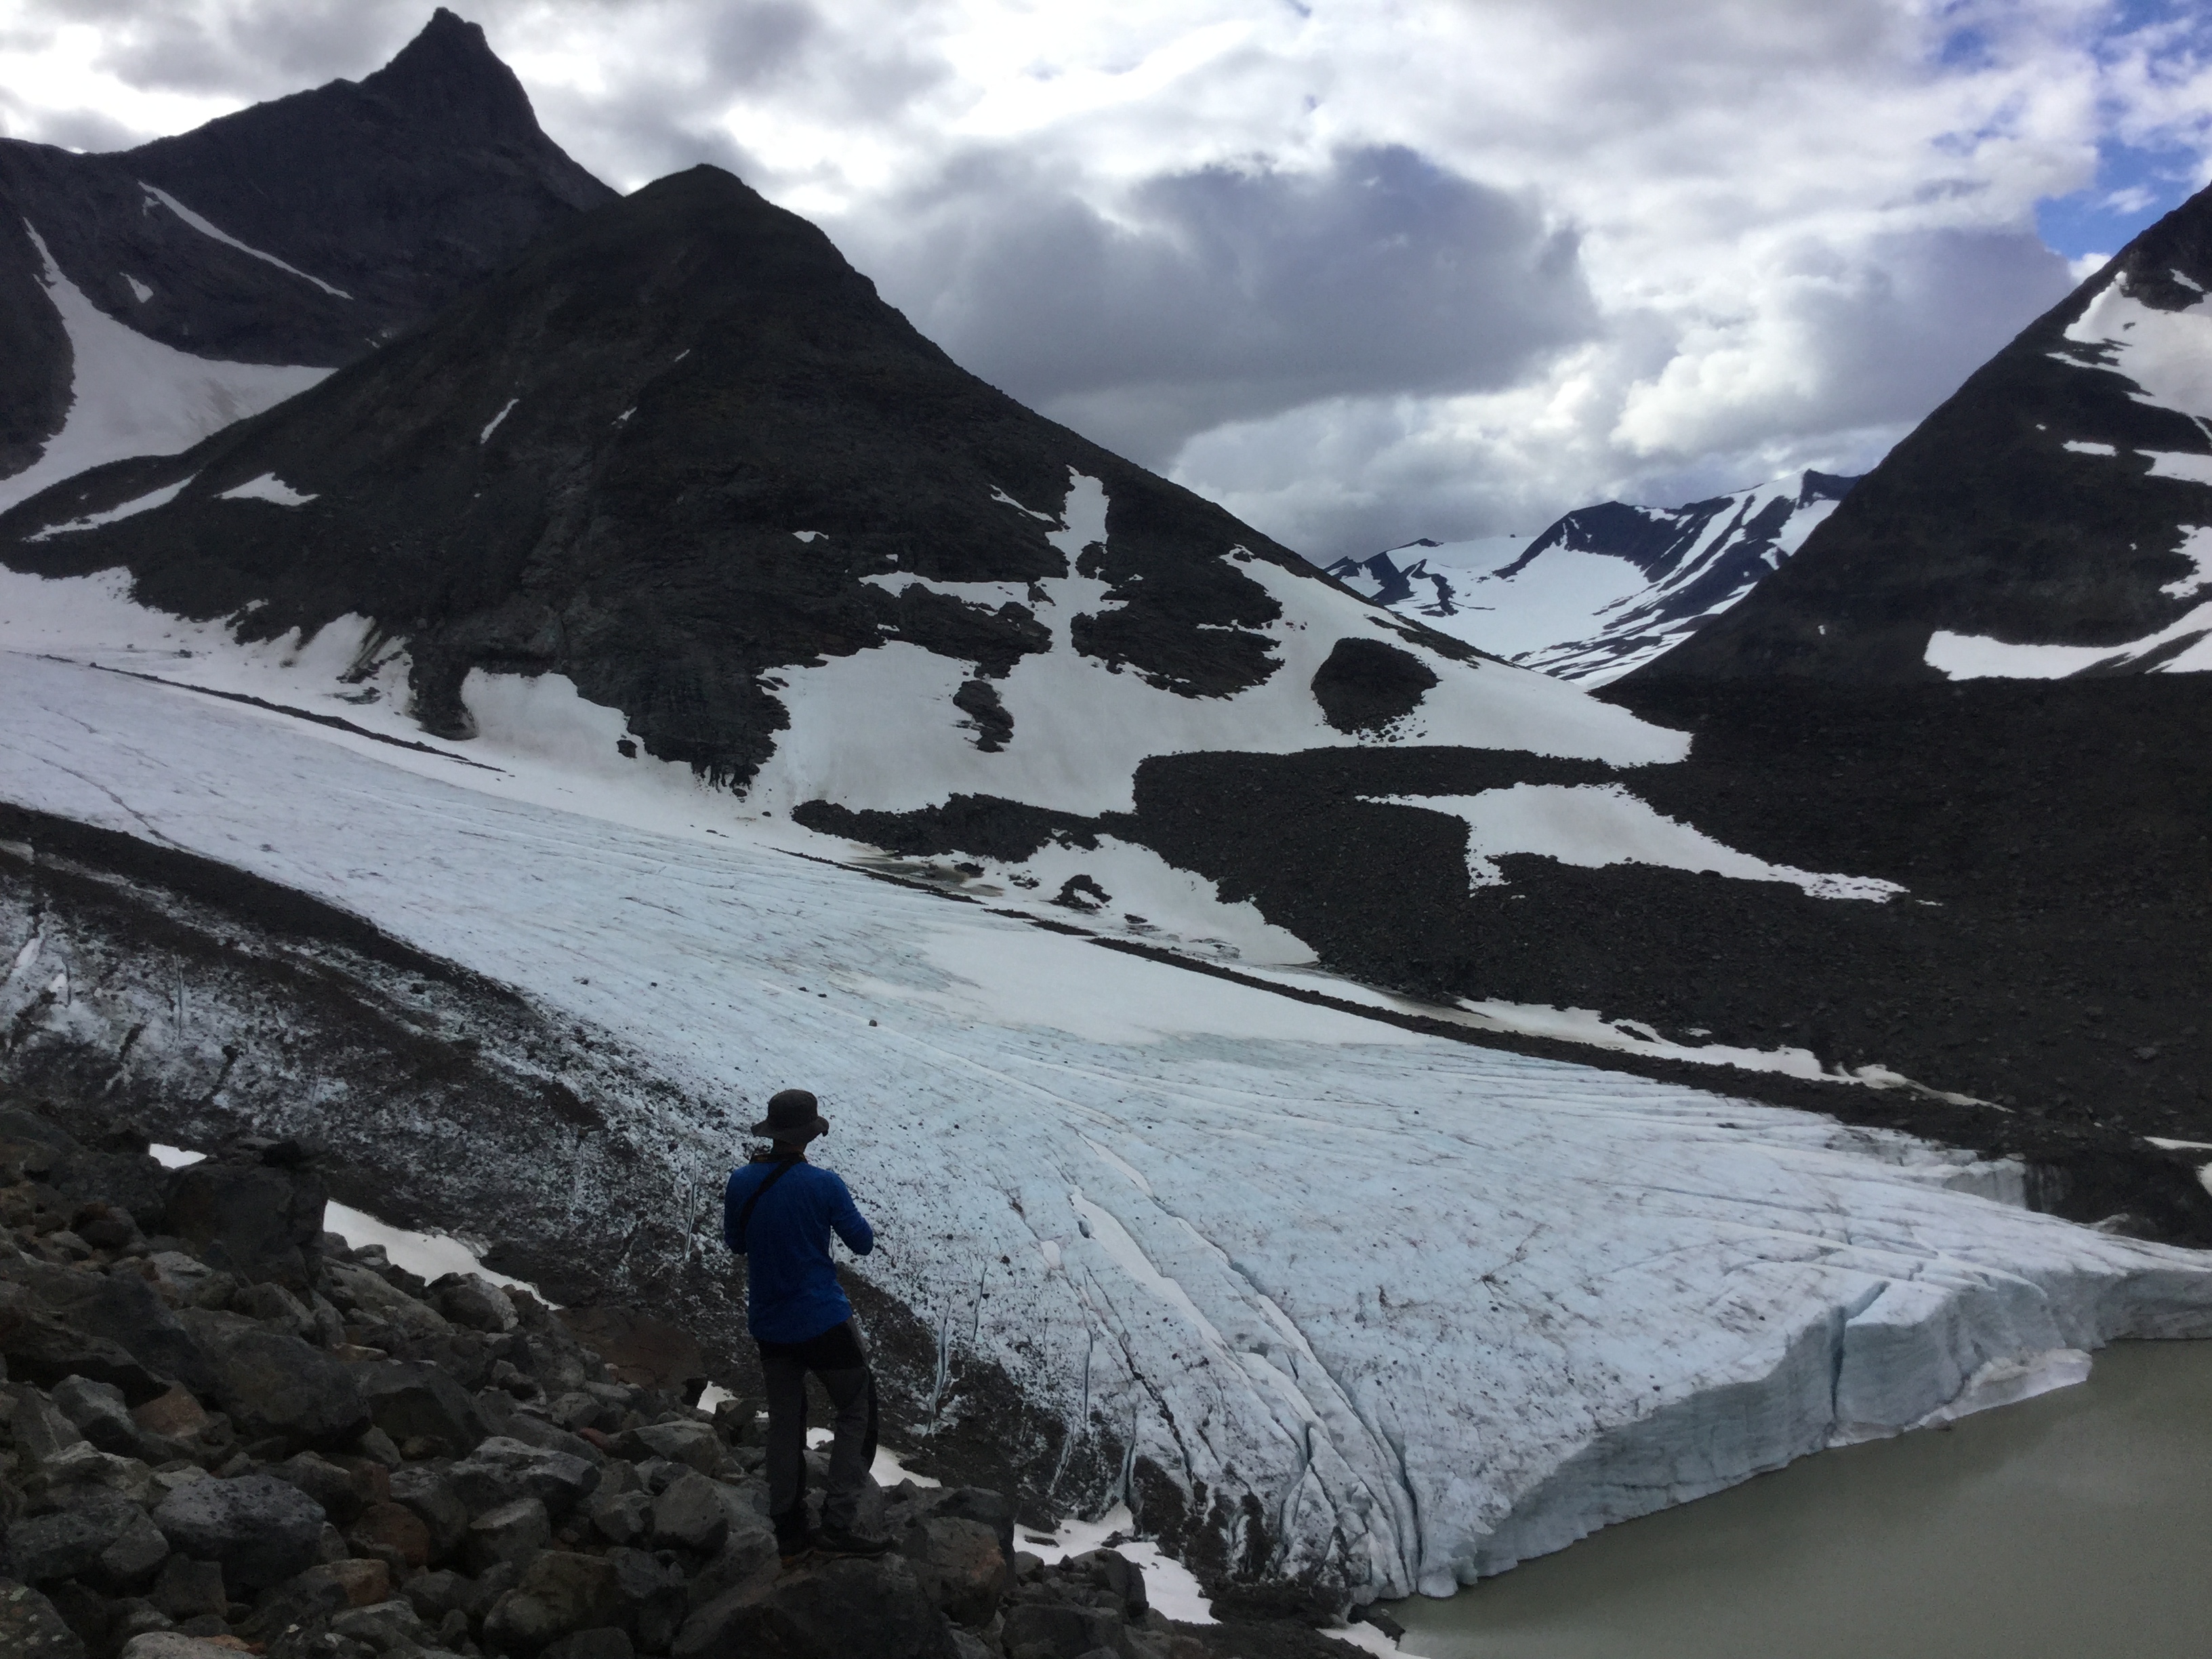
The GLRETA project captures changes in one of the most dynamic parts of an Arctic mountain environment, by measuring lake temperatures in front of a glacier (proglacial) and the regularity of iceberg calving events (monitored by time lapse cameras) driven by thermal undercutting of the glacier terminus. This has proved to be a challenging environment to undertake field work in, as we have to regularly adapt plans to collect data when the weather windows arrive and hope that icebergs don’t wipe out our temperature sensors in the meantime.

Boaty conducting sonar scan and temperature survey along Kaskasapakte proglacial lake. Aug 2022. Photo; A. Dye

The Arctic summer weather can be very variable in Scandinavia and this year has been no exception. The boulder ‘reinforcements’ of our weather station proved to be successful as it survived the 135 km/h wind gusts largely intact. Sadly our base camp tent didn’t fare so well over the summer and also incurred some substantial damage to the door from some passing fauna. On discovering this at the start of trip 2 we realised that scientific objectives had to be postponed as fixing the tent up before the bad weather arrived was ‘rather critical’. Thankfully after 3 days of floods and high winds we were able to forget about base camp maintenance and get back on with the science.

Flooding wiped out our food storage point and nearly flooded our tent on 2 occasions. 60mm of rain in 12 hours is rather a lot! Photo; A. Dye

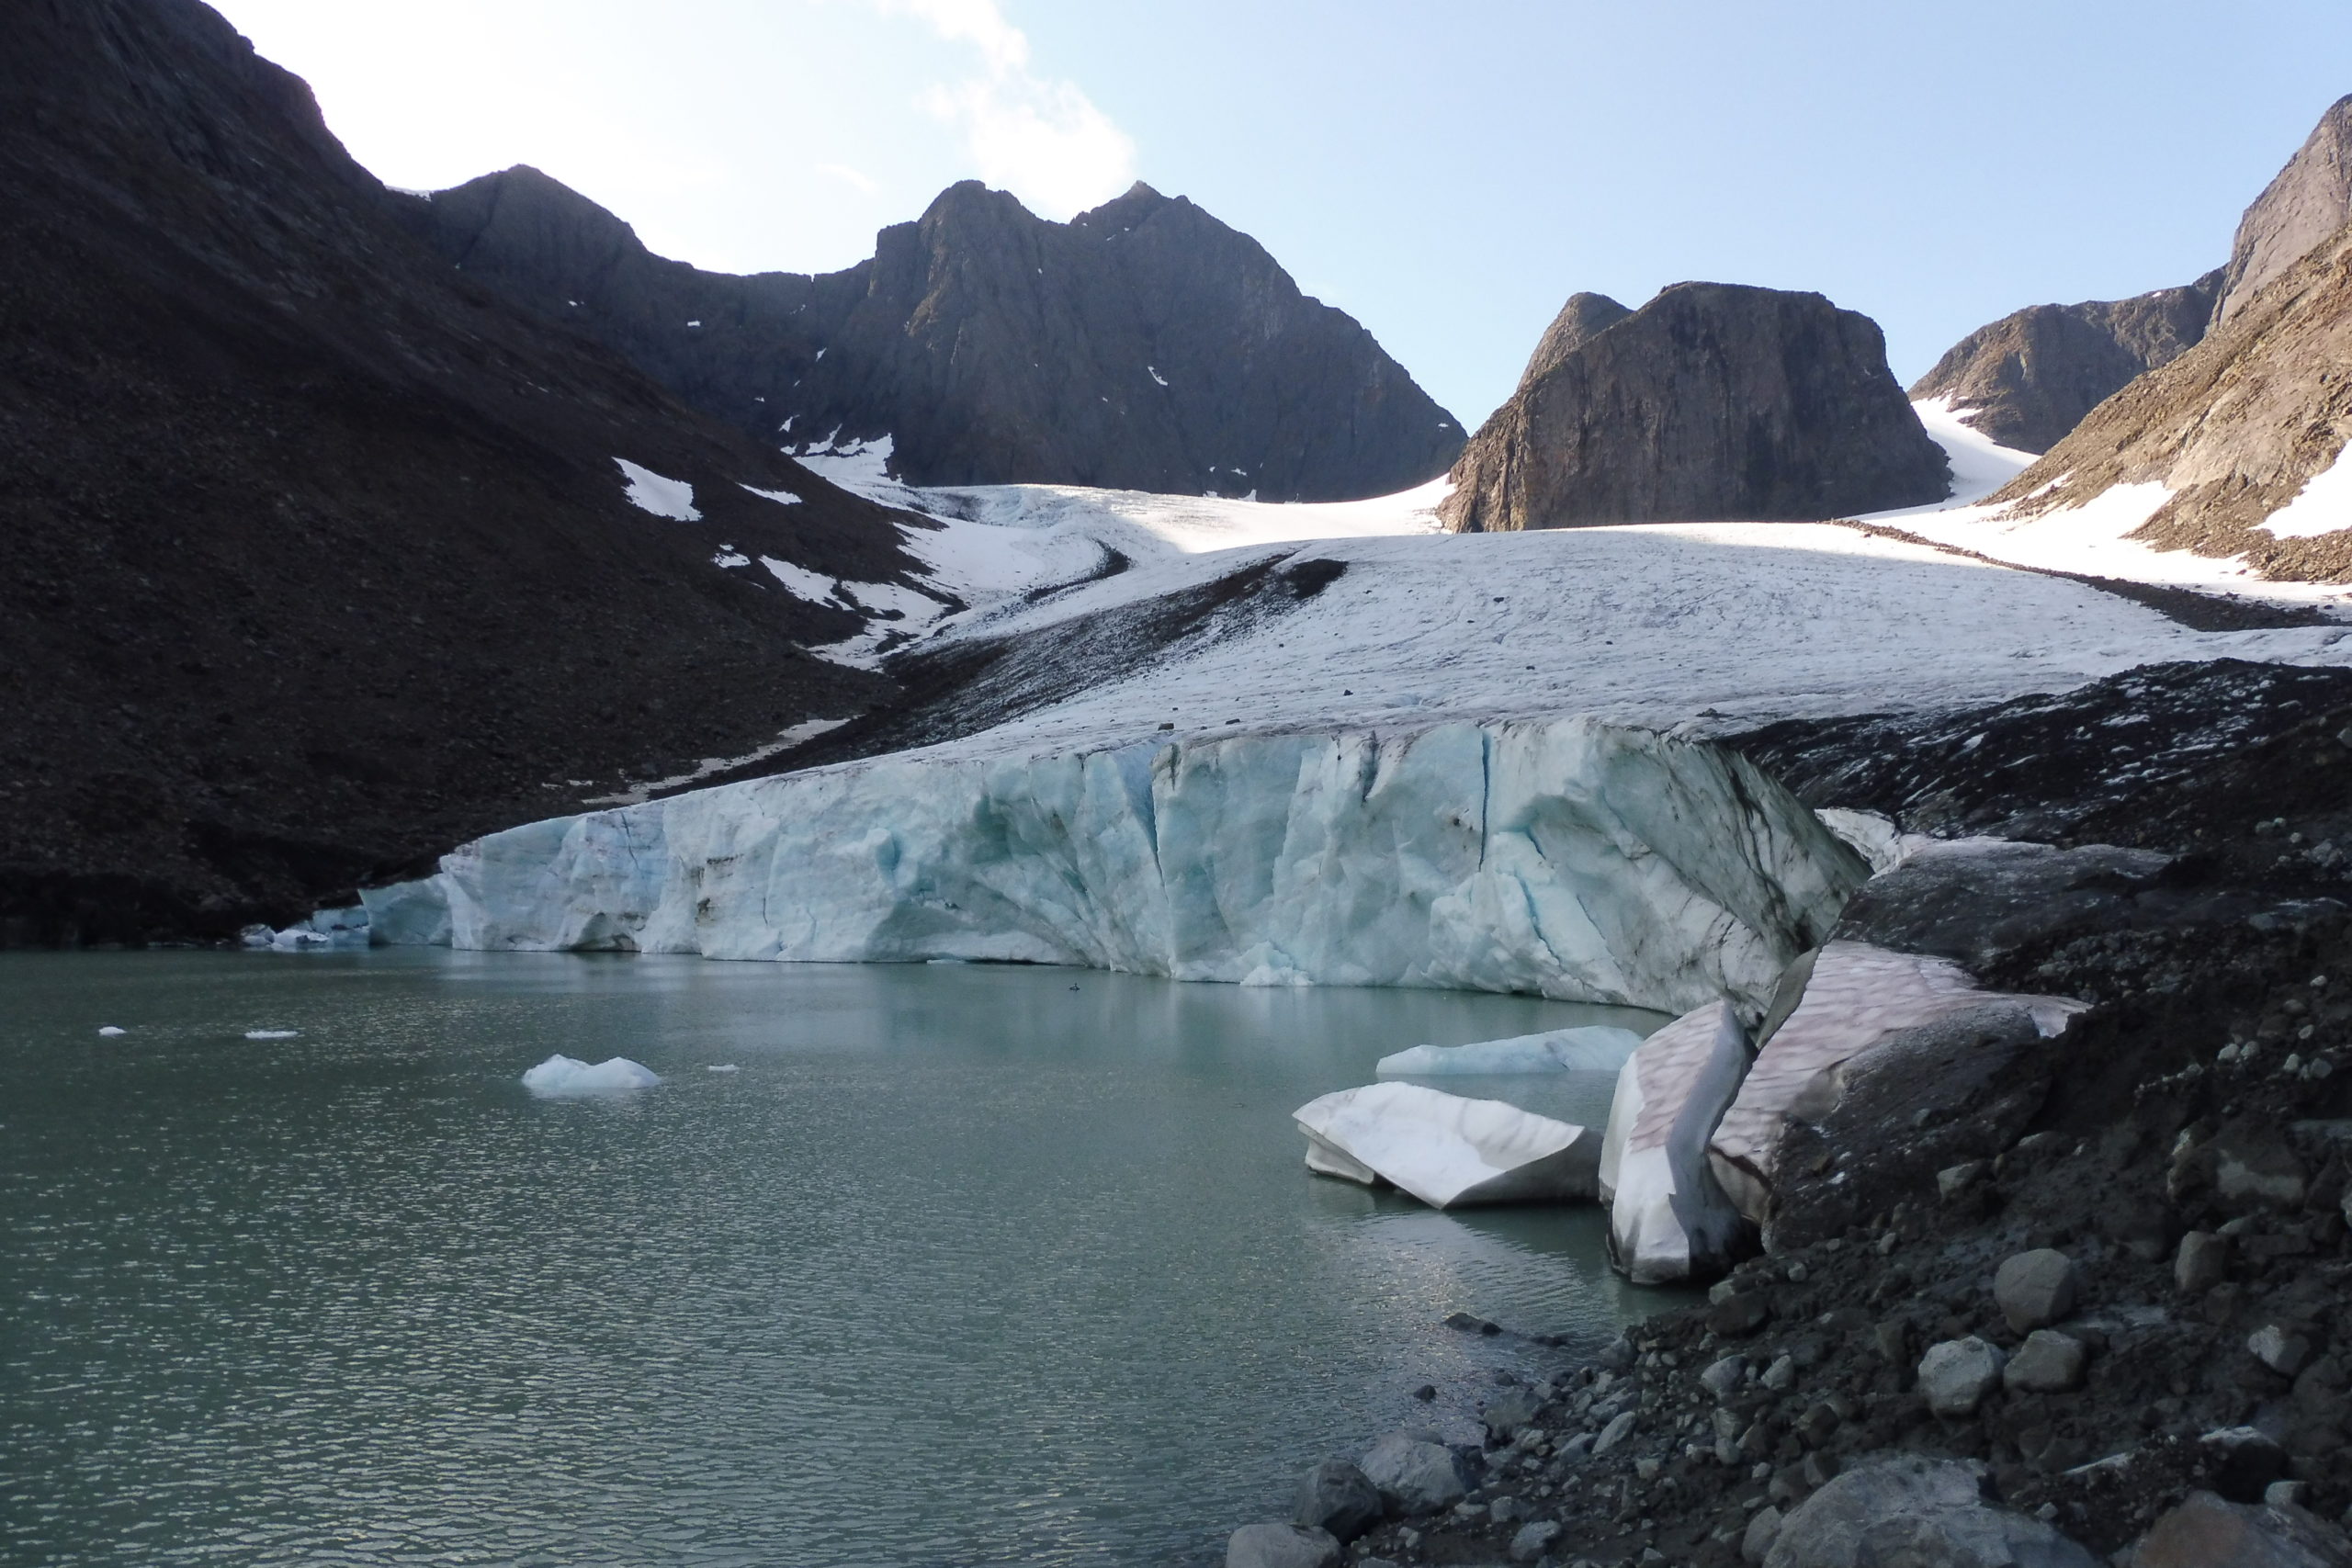
Mercifully we were presented with one of the best weather days I can remember in the Arctic and promptly set about compressing 3 days into one rather long one. First on the agenda was a dSLR camera survey to create a digital surface model of the glacier, to calculate how much the ice has lowered from melting during the summer and how much ice has been calved off in icebergs. The glacier front had changed a lot between our visits over the summer, as about 5m wide strip of ice had been calved off across the terminus and the crevasses behind it had widened substantially. Thankfully our time lapse cameras caught these iceberg calving events, along with the changing lake conditions during the summer. Our inflatable kayak mission was successful in retrieving the key lake temperature data sets, which had risen to a maximum of 4oC in late July before steadily cooling from late August. This will provide an important record for understanding how lake conditions and temperature correspond to iceberg calving events, combined with sonar scans of the terminus to understand how the underwater ice front geometry promotes calving.

GoPro image along Norra Kaskasapakte calving front. Note the large thermally eroded notch at the weaterline. Photo; A Dye.

The recent warm events in Arctic Scandinavia will have enhanced melting of glaciers in the area during the heatwave events, which are predicted to become more frequent with climate change. So we have also been creating digital surface models of other glaciers in the area, to assess how much surface lowering has occurred on these land terminating glaciers. We can then compare the surface lowering of land terminating glaciers to the lake terminating glacier, to assess how they are all responding to recent warm events. We also want to greater understand how contact with a proglacial lake can enhance glacier retreat too and how they are likely to respond to future changes in climate.

Norra Kaskasapakte glaciar, August 2022. Photo; A.Dye

Cold Ice in a Warm Bath

July 2022 GLRETA Arctic Fieldwork Report

We had planned to arrive in the Arctic in the narrow window between Kas’ proglacial lake becoming ice free and the first warm event of the summer, so that we could measure the lake temperatures as they changed as the summer progressed. Unfortunately summer was already well underway as the first real warm event of the season occurred before we arrived, which also seemed to bring numerous mosquitoes with it. In previous trips I had not encountered mosquitoes at our base camp 1000m up in the Arctic/Alpine environment of the Kebnekaise mountains in Sweden. They were not the only signs of warming in the landscape, as our first night trying to sleep in 24 hour daylight (tricky in a tent) was further disturbed by a couple of rather large rockfalls from the surrounding mountains.

Transferring a lot of 20kg bags of equipment between trains… photo. A. Dye
Mike B. and Miles D. setting up the automated weather station underneath the careful watch of mosquitoes at basecamp. Photo A. Dye.

After a somewhat ‘testing’ journey with a substantial amount of baggage, we still had enough energy to scramble over the moraines and see how the glacier front had changed since I saw it 3 years ago. The usual moments of ‘bittersweet’ emotions as the scientist keen to understand a dynamic environment, whilst the environmentalist in me didn’t want to see how much the glacier had retreated. The moraines and environment around the glacier did seem greener, with areas of bare sand now mostly moss covered as well as grass and small Willows becoming more established on the moraines, which also made the going much easier underfoot. The stabilisation of the moraine from vegetation was certainly appreciated and enabled good view points to be accessed more easily.


Mike undertaking a handheld dSLR survey of Kas’ glaciar to create a digital surface model from Structure from Motion. Photo A. Dye

The glacier front had changed quite substantially since I last saw it in September 2019, the large cave in the centre had gone and the majority of the front was less steep, with rounded features that suggested melt processes above water had dominated. The absence of any angular ‘fresh’ cavities on the front confirmed that we had arrived before any icebergs had calved this summer. The large thermally eroded notch running across the full length, suggested that it would not be too long before iceberg calving began… Prominent crevasses behind the central section of the front suggested that a substantial block was waiting to calve from the front, so boaty II was deployed a ‘relatively’ safe distance (20m) away and recorded near surface temperatures of 3 C and a maximum depth of 20m at the ice front, much warmer than I had expected for early July. It was clear that the proglacial lake temperatures and influence on the glacier morphology and retreat rates needed further investigation in what appears to be another eventful third field season.

Boaty II conducting surveys of Kas’ glaciar front July 2022, Arctic Sweden. Photo A. Dye
Boaty II conducting surveys at Kas’ glaciar, Sweden. Photo A. Dye

Working on proglacial lakes can be ‘rather challenging’ most of the time, but occasionally you are gifted with weather windows when it’s ‘all systems go’ in order to get as much data as possible. There was no time for resting after the journey and repeated load hauling (shifting 100kg of baggage through 5 coaches of a busy train isn’t fun) as we installed time lapse cameras, weather station and calibrated thermistors before readying the inflatable kayak for launch. The cold (6 C) cloudy morning morphed into a relatively sunny afternoon and changing into a wetsuit by the side of a cold sediment filled glacial lake in the Arctic was starting to seem less of a crazy idea. Once we’d got our main temperature string installed (with a robust marine buoy…) it even started to seem like a good idea, which may come off if it survives a summer season of icebergs bombarding it and hopefully captures the lake response to whatever summer 2022 throws at it… We paddled on towards the glacier and dropped another thermistor string as close to the front as we dared risk with the impending iceberg blocks waiting to calve about 100m away. It was a relief to be heading away from the glacier and it almost felt pleasant as we drifted away to safety and managed to get another thermistor string stuck in the rocks at the far end of the lake.

Installing thermistor strings on a buoy in the middle of a lake in the Arctic (July 2022). Photo A.Dye

We returned to the glacier front the following day and whilst Miles mapped the lake bathymetry in front of the glacier, Mike dropped some fluorescein dye into streams on top of the glacier. It seemed inevitable that Dr Dye had to use dye tracing at some point, but also proved to be very useful in seeing how meltwater enters the lake and drives currents along the glacier front, which further enhance the thermal undercutting and iceberg calving rates. We also discovered meltwater upwelling in the glacier up to ~5m above the lake level. Why was meltwater being pushed up this high? How would this affect the glacier front? What would happen when rainfall events pumped water through the system? As I typed this it was 3 C and raining/sleating heavily outside. I wouldn’t like to predict what the summer season will bring for Kas’ glaciar this year. It seems pretty crazy that we are now preparing to leave the Arctic and return to temperatures over 30 C in the UK… Hopefully the heatwaves won’t happen in the Arctic this year… We’ll find out how Kas’ glaciar has changed later in the summer and compare the surface changes to other glaciers in the neighbouring area. Watch this space!

Harnessing increased environmental awareness for good – a guest blogpost by Dr Vera Jones

Dr Vera Jones (Associate Director & Water Quality Technical Authority at Atkins | Empower Network co-lead), a regular guest lecturer for our postgraduate courses (MSc in Environmental Management and MSc in Ecology and Conservation), originally published this opinion piece in Atkins Flood & Coast 2022 Thoughts Leadership magazine. It was recently given even wider readership on linkedin and is reproduced in full below.

“Over the past few years – and particularly during the pandemic – many of us have developed an acute awareness of the environment and come to appreciate the benefits of the natural world for our mental and physical health. As a result, we have collectively developed an understanding of the need to take better care of it. This heightened focus on the environment encompasses an increased interest in water quality: the importance of clean blue spaces in terms of social value, as meeting places for our communities, and key drivers for improving our wellbeing. 

“The quality of our water is something many of us take for granted – we drink it, bathe in it, and swim in it without a second thought. While in the UK we are in a privileged position to correctly assume our drinking water is safe, recent media coverage has highlighted that our rivers and coastal waters are not always as clean as we would like them to be [1]. We have been reminded that storm water combined with sewage sometimes spills into watercourses to prevent the sewerage system from being overwhelmed; a fact that has drawn our attention to the fragility of our water environment in an increasingly populated planet. The water industry is rightly carrying out significant investment across the UK to reduce such spills, while also developing ever-more sophisticated systems to monitor spills and keep the public informed on river and coastal water quality. In parallel, we need to continue to raise awareness of the safety of existing processes and all do our best to protect the quality of our water environment – from ensuring our beaches remain clean to making sure sewage pipe misconnections are reported and corrected.

“Increased public interest in water quality also presents a good opportunity to rekindle the discussion around antimicrobial resistance (AMR), which has been declared by the World Health Organisation as a ‘global health and development threat’ [2]. Although work in this field is still ongoing, sewage could be a potential source of AMR in the water environment, and a number of studies have highlighted the potential for AMR exposure in coastal waters [3]. AMR in the environment is a key topic that requires further exploration and data collection to better assess risks and investigate mitigation strategies.

“The pandemic also shone a light on the resilience of our water and wastewater infrastructure, at a time when enormous shifts in population movement and lifestyle occurred in a short space of time. Not only did our water and sewerage system withstand these changes without any significant hitches; it also served as an important vessel for monitoring Covid-19 hotspots and transmission through a government-led wastewater monitoring programme [4]. This showed just how powerful coordinated and intelligent water quality monitoring and analysis could be, and revealed vast potential to understand and tackle a multitude of issues with the support of investment and cross-industry collaboration. Capitalising on our pandemic experience, expanding our existing water quality monitoring and analysis network could give us the tools to unlock a better understanding of multiple pollutants in our watercourses. 

“The fast-changing, post-pandemic world has offered us all a new perspective and the opportunity to re-evaluate priorities. We are collectively more appreciative of the importance of the environment, including good water quality – from our coastal waters to awareness of the threat of AMR, and the importance of a good water quality monitoring framework. We are now seeing significant engagement from the wider public and stakeholders across all aspects of our water environment. As environmental professionals, we need to harness this enthusiasm, bringing together the public, stakeholder organisations, the water industry and government, encouraging everyone to act to preserve our blue spaces and the value they hold – not only for our environment, but for our physical and mental wellbeing as a nation.  We have a unique opportunity to use this increased engagement with the natural world to get everyone working together and to communicate important messages that, right now, will be heard.”

[1] For example: BBC One – Panorama, The River Pollution Scandal

[2] Antimicrobial resistance (who.int)

[3] Leonard, A.F.C., Zhang, L., Balfour, A.J., Garside, R., Gaze. W.H., 2015. Human recreational exposure to antibiotic resistant bacteria in coastal bathing waters. Environment International Volume 82, September 2015, Pages 92-100

[4] EMHP wastewater monitoring of SARS-CoV-2 in England: 1 June to 7 February 2022 – GOV.UK (www.gov.uk)

Arctic Field Season Preview – Cold Ice in a Warm Bath

The Cold Ice in a Warm Bath (CIWB) research team (Dr. Adrian Dye, Dr. Joe Mallalieu, Dr. Fran Falcini, Mike Beckwith and Miles Dimbleby) are busy preparing for their 2022 field season in the Arctic. They work in an area of the Arctic that has recently experienced a number of unusual summer heatwaves (with monthly means >5oC above the long term average; Dye et al., 2021). The 2022 field season research will show how much proglacial lakes (at the terminus of glaciers) enhance retreat rates in their ‘Glacier and Lake Response to Extreme Temperature Anomalies’ (GLRETA) project, which has been funded by INTERACT and the Royal Geographical Society.

A series of Arctic glaciers will be surveyed (by UAV) to create digital surface models from photogrammetry (using SfM) and assess the glacier retreat that has occurred in response to the heatwaves since 2015. Crucially this will be combined with sonar surveys (from remote controlled boat) and carefully placed (to avoid icebergs!) temperature sensors to constrain subaqueous melt of Kas’ glacier in relation to proglacial lake warming during the summer. This will be the third field season that the team has spent at Kas’ glacier. If it is anywhere near as eventful as the previous two, they will capture the frequent iceberg calving events (on timelapse) and hopefully one of the longest temperature records from an Arctic proglacial lake (if icebergs don’t disrupt it too much!).

The calving front of Kaskapakte (Kas’) glaciar in Arctic Sweden (July 2019).
Boaty II conducting sonar surveys of the underwater terminus of Kas’ glaciar whilst filming ice structures by GoPro.

Dr Katy Chamberlain presenting at international conferences

Our very own Dr Katy Chamberlain recently presented volcanological research on the 2021 Cumbre Vieja eruption at La Palma at two international conferences- the annual European Geosciences Union (EGU) meeting, in Vienna Austria, and the hybrid JpGU annual meeting in Japan (online).  At both conferences Dr. Chamberlain presented the research funded by the NERC urgency proposal held at Teesside University, looking at how the magmas that fed the 3 month long eruption evolved over time. The data from analysing lava and tephra samples show a clear change in how magmas evolved during the eruption which will be linked to monitoring records of the eruptive event. Alongside presenting scientific research, Katy was also a panellist at a ‘Great Debate’ at EGU, where a group of panellist discussed challenges and potential solutions for making geochemical data open and FAIR to increase their longevity and reuse in future studies. This included talking about how the OneGeochemistry initiative can be structured to ensure equitable access to geochemical data for all.

Dr Baldini’s collaboration with the Durham Wildlife Trust to research microplastic pollution from Source to Sea

Plastic pollution in the marine environment is widely recognised as one of the major challenges of our time. In an attempt to contribute to addressing this problem Dr Lisa Baldini and the Durham Wildlife Trust decided to tackle the problem at the source. The project from Source to Sea investigates the source and abundance of plastics in river sediments and waters focussing on the River Wear. This work will not only inform conservation work for the river Wear, but also benefit coastal habitat in the North Sea where plastic get transported to and, importantly, serve as a case study of international relevance.

Sampling field work has been conducted throughout the summer and into the autumn of 2021.